Manually Setting Up Prometheus on a Single-Node K8s Cluster
The target audience for this article is beginners who are just starting to learn about monitoring systems and have little knowledge of Prometheus (much like the author when writing this article).
Environment used for setting up Prometheus in this article:
- K8s version: 1.19.3
- Prometheus version: 2.22.0
- Operating System: Archlinux at 2020.11
- Hosts configured, domain name for Devbox is
devbox⚠️ Please note: The command-line arguments listed in this article need to be adjusted slightly according to your current environment (e.g., Prometheus binary version, etc.).
Here are some recommended pre-reading items:
- Observability: Concepts and Best Practices introduces various basic concepts of observability.
- Getting to Know Prometheus introduces the Prometheus project.
- Introduction on the Prometheus Official Website
Goal
Since we are manually setting up Prometheus on K8s, we have two conventions here:
- Deliberately avoid using quick deployment methods like Helm-Chart, Prometheus Operator, etc. Listed here for reference:
- Prometheus community-maintained Helm chart
- Prometheus Operator
- Kube-Prometheus
- Setting up Prometheus on K8s means K8s is responsible for managing the Prometheus service. Unlike the Prometheus Operator mentioned above, here we need to write all the relevant YAML configuration files ourselves.
- List the following monitoring targets:
- Prometheus
- Node exporter
- Kubelet
- Cadvisor
- ApiServer
Let’s get started!
Proof of Concept Running Prometheus on Bare Metal
First, the initial instinct is to do a proof of concept on bare metal. Get it running first, then experiment with further configurations. Ultimately, once we understand Prometheus’s various configuration items, redeploying it to K8s should be straightforward.
I wanted to try taking shortcuts. After searching for tutorial blogs, I found them unclear and mostly outdated. As a result, I wasted half a day and had to honestly read the official documentation.
Installing Prometheus
According to the documentation, download the corresponding pre-compiled binary package directly from here:
curl -LO "https://github.com/prometheus/prometheus/releases/download/v2.22.0/prometheus-2.22.0.linux-amd64.tar.gz"
tar -zxvf prometheus-2.22.0.linux-amd64.tar.gz
cd prometheus-2.22.0.linux-amd64
./prometheus --version
# expected output should be like this:
# prometheus, version 2.22.0 (branch: HEAD, revision: 0a7fdd3b76960808c3a91d92267c3d815c1bc354)
#  build user:    root@6321101b2c50
#  build date:    20201015-12:29:59
#  go version:    go1.15.3
#  platform:     linux/amd64
Looking at the directory, you’ll find it comes with a configuration file prometheus.yml:
# my global config
global:
  scrape_interval:     15s # Set the scrape interval to every 15 seconds. Default is every 1 minute.
  evaluation_interval: 15s # Evaluate rules every 15 seconds. The default is every 1 minute.
  # scrape_timeout is set to the global default (10s).

# Alertmanager configuration
alerting:
  alertmanagers:
  - static_configs:
    - targets:
      # - alertmanager:9093

# Load rules once and periodically evaluate them according to the global 'evaluation_interval'.
rule_files:
  # - "first_rules.yml"
  # - "second_rules.yml"

# A scrape configuration containing exactly one endpoint to scrape:
# Here it's Prometheus itself.
scrape_configs:
  # The job name is added as a label `job=<job_name>` to any timeseries scraped from this config.
  - job_name: 'prometheus'

    # metrics_path defaults to '/metrics'
    # scheme defaults to 'http'.

    static_configs:
    - targets: ['localhost:9090']
Now, let’s run the Prometheus we just downloaded to monitor itself, achieving a small feedback loop of satisfaction:
./prometheus --config.file=prometheus.yml
You can see that Prometheus has started. Access http://devbox:9090 to see its web UI. Click around randomly to get a general feel for the features Prometheus provides, giving us an understanding of how Prometheus behaves when running normally.
Running Node Exporter
Now, let’s run a Node Exporter on bare metal to observe various metrics of the local machine.
curl -LO "https://github.com/prometheus/node_exporter/releases/download/v1.0.1/node_exporter-1.0.1.linux-amd64.tar.gz"
tar -zxvf node_exporter-1.0.1.linux-amd64.tar.gz
cd node_exporter-1.0.1.linux-amd64
./node_exporter
Next, modify the configuration to let Prometheus scrape metrics from it.
# my global config
global:
  scrape_interval:     15s # Set the scrape interval to every 15 seconds. Default is every 1 minute.
  evaluation_interval: 15s # Evaluate rules every 15 seconds. The default is every 1 minute.
  # scrape_timeout is set to the global default (10s).

# A scrape configuration containing exactly one endpoint to scrape:
# Here it's Prometheus itself.
scrape_configs:
  # The job name is added as a label `job=<job_name>` to any timeseries scraped from this config.
  - job_name: 'prometheus'

    # metrics_path defaults to '/metrics'
    # scheme defaults to 'http'.

    static_configs:
    - targets: ['localhost:9090']

  - job_name: 'node-exporter'
    static_configs:
    - targets: ['localhost:9100']
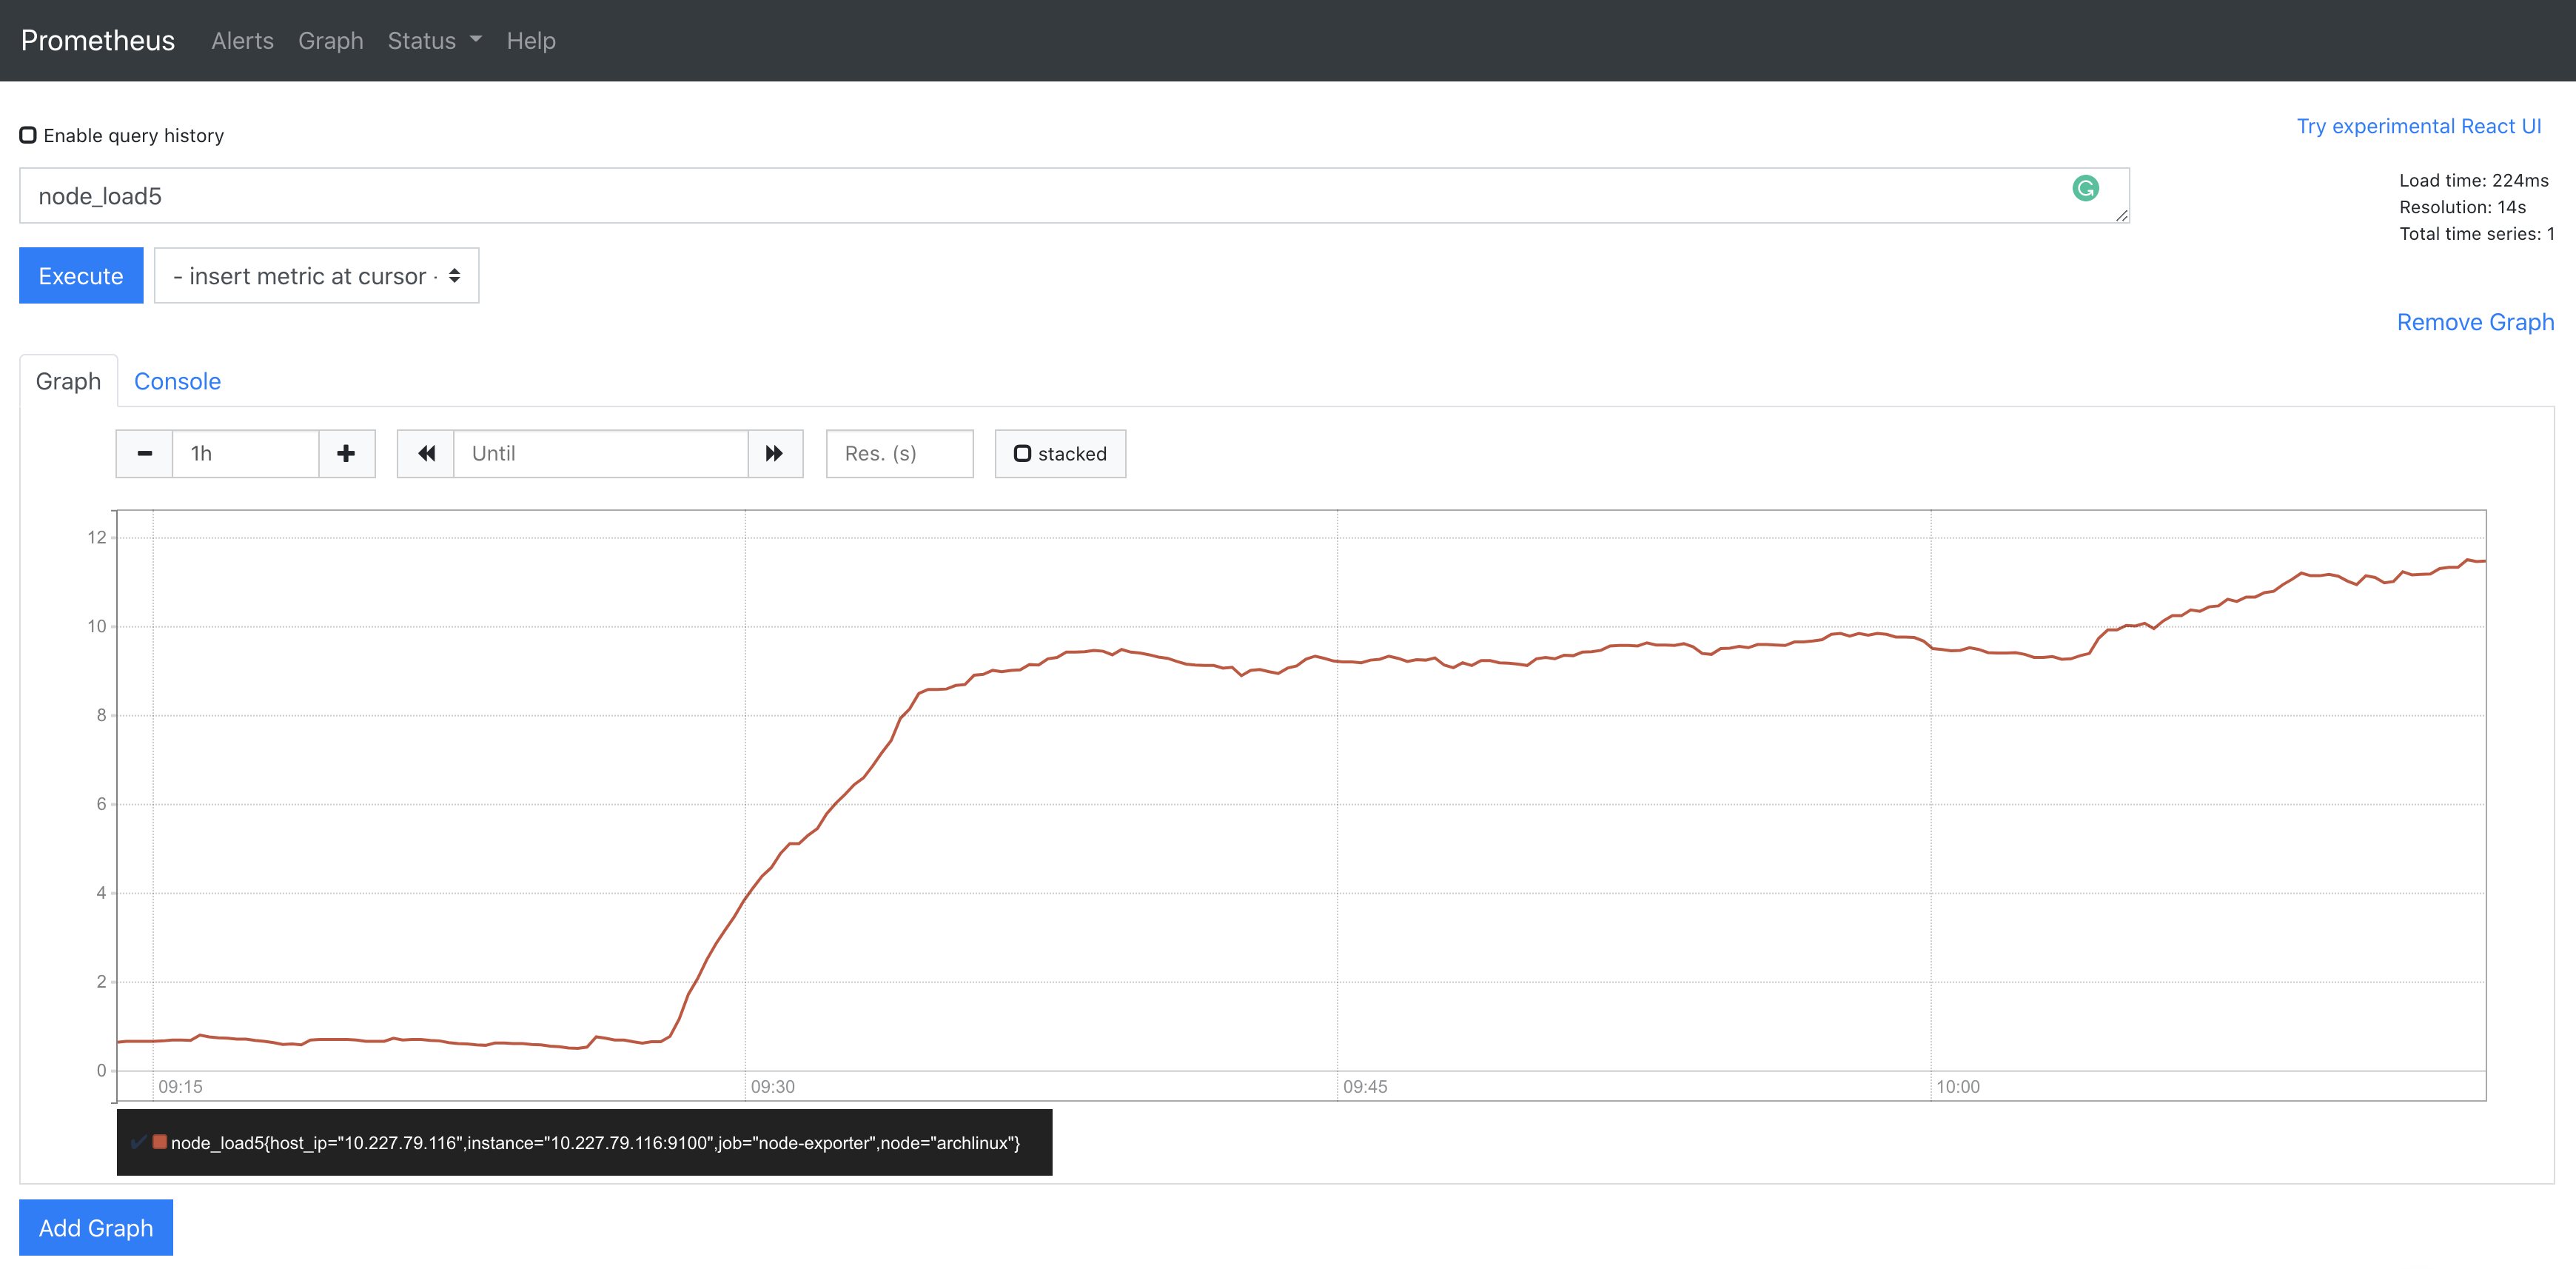
Open Prometheus’s web UI and observe that a new target named node-exporter has been added. Check the workload (running a program that can occupy all cores by endlessly calculating Fibonacci numbers):
At this point, the proof of concept phase is successfully completed.
Note: As part of the proof of concept, it is not recommended to directly use bare-metal deployed Prometheus to monitor a K8s cluster. The reason is that accessing K8s components from outside the cluster requires configuring certificates and having a ClusterRole with appropriate access permissions (omitting the various pitfalls the author encountered when trying to monitor a K8s cluster and its components with bare-metal Prometheus).
Monitoring the K8s Cluster with Prometheus
Next, we want to monitor our K8s cluster through Prometheus.
Prometheus Configuration Items
From the introduction to Prometheus, we know that Prometheus is primarily Pull-based for data acquisition. Therefore, it needs service discovery—letting Prometheus know where to pull data from, so users can view it.
So the first problem to solve is: Service discovery for the K8s cluster—the secret must be hidden in the configuration.
The documentation provides a detailed description of Prometheus configuration.
Let’s briefly describe the following configuration items (they are not necessarily orthogonal to each other):
<global>: The configuration within it applies to any other configuration item and serves as the default value for items in other configurations.<scrape_config>: Defines a monitoring job, describing where and how Prometheus should monitor this target, among other information.<tls_config>: Describes TLS configuration.<*_sd_config>: Prometheus provides configuration for service discovery of a series of predefined monitoring targets through this series of configuration items (sd stands for service discovery).<static_config>: For monitoring targets not predefined by Prometheus (e.g., any service manually deployed on bare metal), this configuration item can be used for service discovery. We used this configuration item in the proof of concept above.<relabel_config>: Before starting to scrape metrics from monitoring targets, this configuration item can be used to modify some labels. Prometheus provides some predefined label rules. Relabeling can be done in multiple steps. After relabeling, labels prefixed with__are deleted.
It seems the core configuration item in Prometheus is its <scrape_config>. Each one defines a monitoring job, similar to a namespace concept, primarily providing aggregation of monitoring targets. Within it, we tell Prometheus specifically from which endpoints to pull data and how to filter these endpoints by defining <*_sd_config> or <static_config>.
Let’s deepen our understanding of these configuration items through practice!
Deploying Prometheus
The core work of deployment lies in clearly thinking about what resources are needed to deploy Prometheus in the cluster. The author directly reveals the answer here:
- A dedicated Namespace
- A DaemonSet to manage node-exporter
- Node-exporter Service
- Managing Prometheus configuration with a ConfigMap
- Prometheus-specific ServiceAccount
- A ClusterRole with sufficient permissions
- A ClusterRoleBinding that binds the ServiceAccount and ClusterRole together
- Prometheus Deployment
- Prometheus Service
On a K8s cluster with RBAC applied, we need to define a role with sufficient permissions for Prometheus to read cluster status and various metrics, hence items 5-7.
Here is a collection of resource declarations accumulated by the author during their own setup process. In addition to the above resources, it also includes kube-state-metrics. Following the steps in order will result in a deployed Prometheus.
Node-exporter
For Node-exporter, since it monitors the machine itself, the requirement is one per Node. Since we also want to enjoy K8s lifecycle management, DaemonSet is the best choice.
Since it runs in a container, without configuration, it cannot collect real Node metrics. Therefore, it is necessary to mount special locations from the host into the container so that Node-exporter can collect metrics.
args:
  - '--path.procfs=/host/proc'
  - '--path.sysfs=/host/sys'
  - '--path.rootfs=/host/root'
volumes:
  - hostPath:
      path: /proc
    name: proc
  - hostPath:
      path: /sys
    name: sys
  - hostPath:
      path: /
    name: root
Then expose an endpoint that Prometheus can access long-term through a Service.
Prometheus
Prometheus is deployed using a Deployment. Before deploying Prometheus, it needs to be configured with sufficient permissions to access necessary endpoints to collect metrics. In a K8s cluster with RBAC configured, this goal is achieved through ClusterRole/ServiceAccount/ClusterRoleBinding. After configuration, Prometheus uses the ServiceAccount for corresponding authentication to access the required endpoints.
apiVersion: rbac.authorization.k8s.io/v1
kind: ClusterRole
metadata:
  name: prometheus
  labels:
    app.kubernetes.io/name: prometheus
rules:
  - apiGroups: [""]
    resources:
      - nodes
      - nodes/metrics
      - services
      - endpoints
      - pods
    verbs: ["get", "list", "watch"]
  - nonResourceURLs:
      - "/metrics"
      - "/metrics/cadvisor"
    verbs: ["get"]
---
apiVersion: v1
kind: ServiceAccount
metadata:
  name: default
  namespace: monitoring-system
  labels:
    app.kubernetes.io/name: prometheus
---
apiVersion: rbac.authorization.k8s.io/v1
kind: ClusterRoleBinding
metadata:
  name: prometheus
  labels:
    app.kubernetes.io/name: prometheus
roleRef:
  apiGroup: rbac.authorization.k8s.io
  kind: ClusterRole
  name: prometheus
subjects:
  - kind: ServiceAccount
    name: default
    namespace: monitoring-system
So far, we have all the prerequisites to achieve our monitoring goals. So how do we drive the powerful Prometheus engine to make full use of the environment we’ve set up for monitoring?
Combining the introduction to Prometheus configuration earlier, the four monitoring targets are defined with four <scrape_config>s:
For node-exporter:
- job_name: 'node-exporter'
  kubernetes_sd_configs:
    - role: endpoints
  relabel_configs:
    - source_labels: [__meta_kubernetes_service_name]
      regex: node-exporter
      action: keep
    - source_labels: [__meta_kubernetes_endpoint_node_name]
      target_label: node
    - source_labels: [__meta_kubernetes_pod_host_ip]
      target_label: host_ip
Since it’s inside the cluster, no additional authentication is needed, and HTTPS access is not required.
Let’s further explain <relabel_configs> using the node-exporter example:
A label is an attribute of a certain endpoint. Different endpoints may have different values under the same label. What <relabel_config> does is perform some modification and filtering operations on these labels, allowing us to filter/modify the desired endpoints.

As you can see, in the config above, there are three relabel actions. The first one means: from all values of the K8s service discovery predefined label __meta_kubernetes_service_name, filter according to the given regular expression “node-exporter”. Based on the action, keep the matching target endpoints and discard the remaining values with the same label. The latter two relabel actions are to retain the semantic labels node and host_ip by renaming them. (Remember, labels starting with double underscores are eventually deleted.)
For Prometheus itself:
- job_name: 'prometheus'
  kubernetes_sd_configs:
    - role: endpoints
  relabel_configs:
    - source_labels: [__meta_kubernetes_service_name]
      regex: prometheus
      action: keep
Use the same trick to filter out endpoints.
For kubelet and cadvisor, the situation becomes slightly more complex:
- job_name: 'kubelet'
  kubernetes_sd_configs:
    - role: node
  tls_config:
    # ca_file: /var/run/secrets/kubernetes.io/serviceaccount/ca.crt
    # cert_file: /etc/secret/cert
    # key_file: /etc/secret/key
    insecure_skip_verify: true
  bearer_token_file: /var/run/secrets/kubernetes.io/serviceaccount/token
  scheme: https

- job_name: 'cadvisor'
  kubernetes_sd_configs:
    - role: node
  metrics_path: /metrics/cadvisor
  tls_config:
    # ca_file: /var/run/secrets/kubernetes.io/serviceaccount/ca.crt
    # cert_file: /etc/secret/cert
    # key_file: /etc/secret/key
    insecure_skip_verify: true
  bearer_token_file: /var/run/secrets/kubernetes.io/serviceaccount/token
  scheme: https
Note that the role has changed to node, so Prometheus will default to collecting metrics from <node_ip>:10250/metrics. Here, there is an additional bearer_token_file configuration item. Since kubelet does not allow anonymous access to its metric data by default, this is where the ServiceAccount configured earlier is used. For convenience, we use insecure_skip_verify: true to skip TLS authentication.
For ApiServer, it becomes slightly more complex again:
scrape_configs:
  - job_name: 'kubernetes-apiservers'
    kubernetes_sd_configs:
      - role: endpoints
    scheme: https
    tls_config:
      ca_file: /var/run/secrets/kubernetes.io/serviceaccount/ca.crt
    bearer_token_file: /var/run/secrets/kubernetes.io/serviceaccount/token
    relabel_configs:
      - source_labels: [__meta_kubernetes_namespace, __meta_kubernetes_service_name, __meta_kubernetes_endpoint_port_name]
        action: keep
        regex: default;kubernetes;https
Here, we use <relabel_config> to filter the ApiServer’s own endpoints. While providing token authentication, we also need to provide a CA file for identity verification, so we can access the ApiServer.
Thus, we have completed the deployment of Prometheus and the monitoring configuration for the target endpoints.
Interested readers can further modify the config to observe Prometheus’s behavior under different configurations to deepen understanding. Here’s a small assignment: How can we monitor a K8s cluster with a bare-metal deployed Prometheus?